Nonsequential TikZ overlay figures for presentations
04 May 2016
Creating overlays with TikZ in beamer works nicely with the \onslide and \only commands, but I'm a fan of creating standalone graphics and include them into my presentations or documents later. A way to achieve nonsequential overlay figures is using multiple \input files that make up the different figures.
An example of what I want to achieve
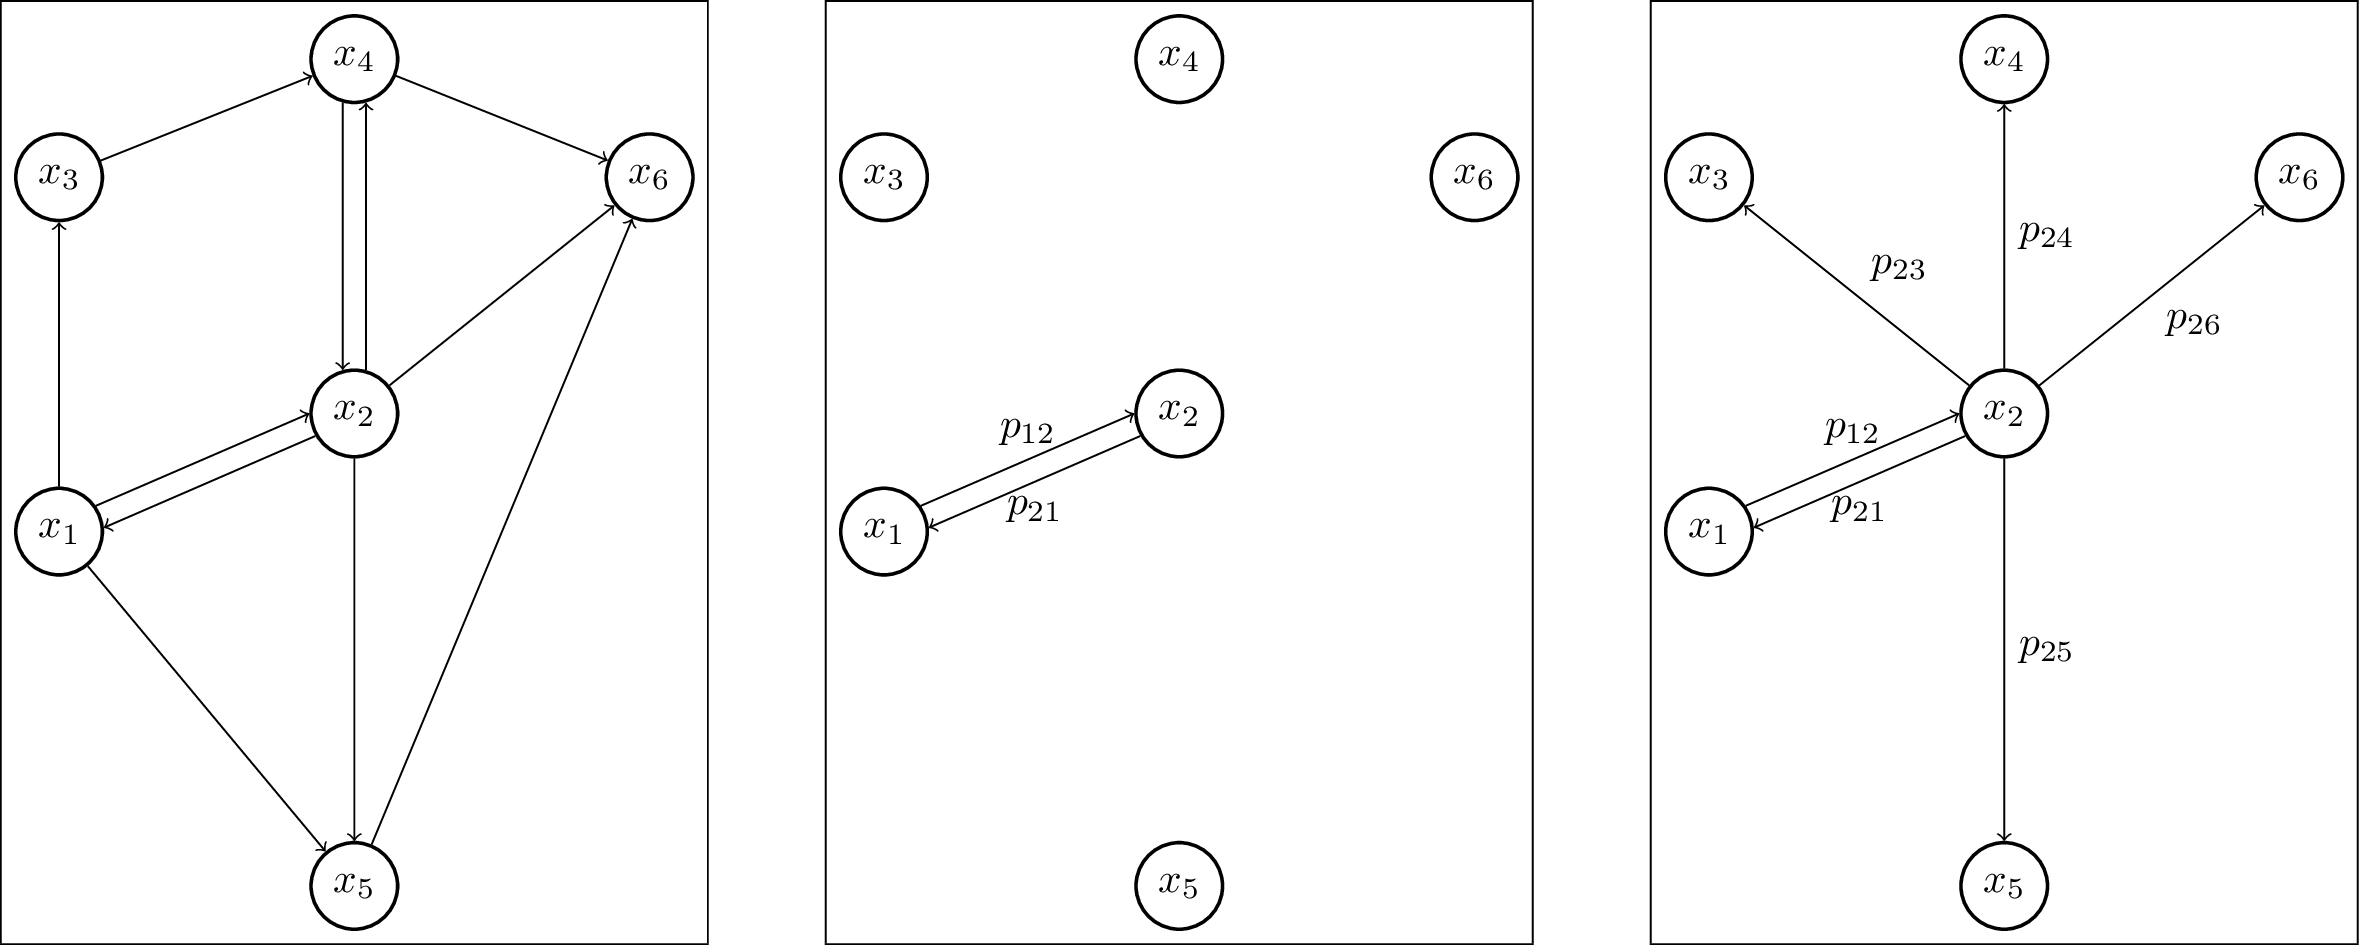
This the main LaTeX files that will be compiled
\documentclass{standalone}

\usepackage{local_set}

\begin{document}

\begin{tikzpicture}

  \input{inputs/base}

  \input{inputs/set1}

\end{tikzpicture}

\end{document}
With the input inputs/base.tex
\begin{scope}[every node/.style={circle,thick,draw}]
  \node (x1) at (0,0) {$x_1$};
  \node (x2) at (2.5,1) {$x_2$};
  \node (x3) at (0,3) {$x_3$};
  \node (x4) at (2.5,4) {$x_4$};
  \node (x5) at (2.5,-3) {$x_5$};
  \node (x6) at (5,3) {$x_6$} ;
\end{scope}
and inputs/set1
\path [->] (x1) edge node {} (x3);
\path [->] (x3) edge node {} (x4);
\path [->] (x2.75) edge node {} (x4.285);
\path [<-] (x2.105) edge node {} (x4.255);
\path [->] (x1) edge node {} (x5);
\path [->] (x2) edge node {} (x5);
\path [->] (x2) edge node {} (x6);
\path [->] (x4) edge node {} (x6);
\path [->] (x5) edge node {} (x6);
\path [->] (x1.35) edge node[above] {} (x2.180);
\path [<-] (x1.5) edge node[below] {} (x2.210);
Finally, the overlaid figures
The full code is in the GitHub repository. Let me know if this was helpful.